Design daily boundaries, protect deep work, and run weekly reviews: that combination does more for sustainable balance than any single trick. Expect steadier energy and less burnout drift once boundaries are in place, and you can start today by picking one boundary (a...
Use time blocking for sustained deep work on a single project, and use task batching to group shallow, repeatable tasks into one focused session. Both methods solve the same underlying problem, which is constant context switching, but they solve it differently, and...
Open a dedicated business bank account and route every bit of business income there, right from the start. Pair it with a business credit card and standalone bookkeeping, and pay yourself through documented draws or payroll instead of pulling cash whenever you need...
Plan 2026 by picking 3 to 5 annual priorities, writing an if-then plan for each using mental contrasting, converting every priority into tracked projects and milestones, and running quarterly plus weekly reviews inside one integrated planner. This approach keeps...
Founders should track three things first: deep work hours, personal well-being basics like sleep and movement, and a weekly review. Start with one to three habits, log them in under 60 seconds each morning, and treat the data as a business input rather than a personal...
Digital minimalism for work means using only the tools and notifications that earn a place in your day, so attention goes to the tasks that matter. The single fastest move is to protect a scheduled focus block on your calendar and mute every nonessential notification...
Use a one-page marketing planner built around a single quarterly goal, monthly campaign boxes, and weekly 30 to 60 minute execution blocks. This structure gives you clarity on what to work on today and protects you from the burnout that comes with juggling ten...
The best approach depends on frequency and sensitivity: use a client portal for recurring or sensitive exchanges, secure email or password-protected transfers for occasional low-risk files, e-signature services for anything requiring a signature, and managed file...
Make a room-by-room, photo-backed inventory of everything you own, then store a copy somewhere other than your house. Start today: pick your most valuable room and film a slow walkthrough narrating what you see, then upload whatever list you already have to a cloud...
A weekly review is a short, scheduled ritual where you clear your inboxes, check your calendar, and pick your priorities before the new week starts. The simplest version takes 15 to 20 minutes: dump loose tasks into one list, scan the next seven days, and write down...
Daily Metrics for Work and Life: Ask First, Track Less
Daily metrics tracking means watching a few current, high-frequency numbers that warn you early and let you correct course. Start by choosing a key performance question, then pick a small set of daily measures that answer it, such as time on priority tasks, completed priority tasks, or new leads. Key performance questions keep the numbers tied to what you actually need to know.
TL;DR:
Start with one key performance question, then choose no more than five actionable daily measures, each with a source and a clearly assigned owner.
Record each measure in under a minute, automate data already captured in calendars, payment feeds, or dashboards, and use manual checks for activity without a trail.
Establish a baseline, compare rolling averages rather than single days, and define triggers in advance before testing one small change at a time.
Pair activity counts, such as sales calls, with quality measures like meetings booked, since volume targets can encourage behavior that misses the real goal.
Review daily for immediate action, weekly for trends and experiments, and monthly against outcomes; retire measures that stop prompting decisions or distort behavior.
LifeDesk
Keep Work and Life in View
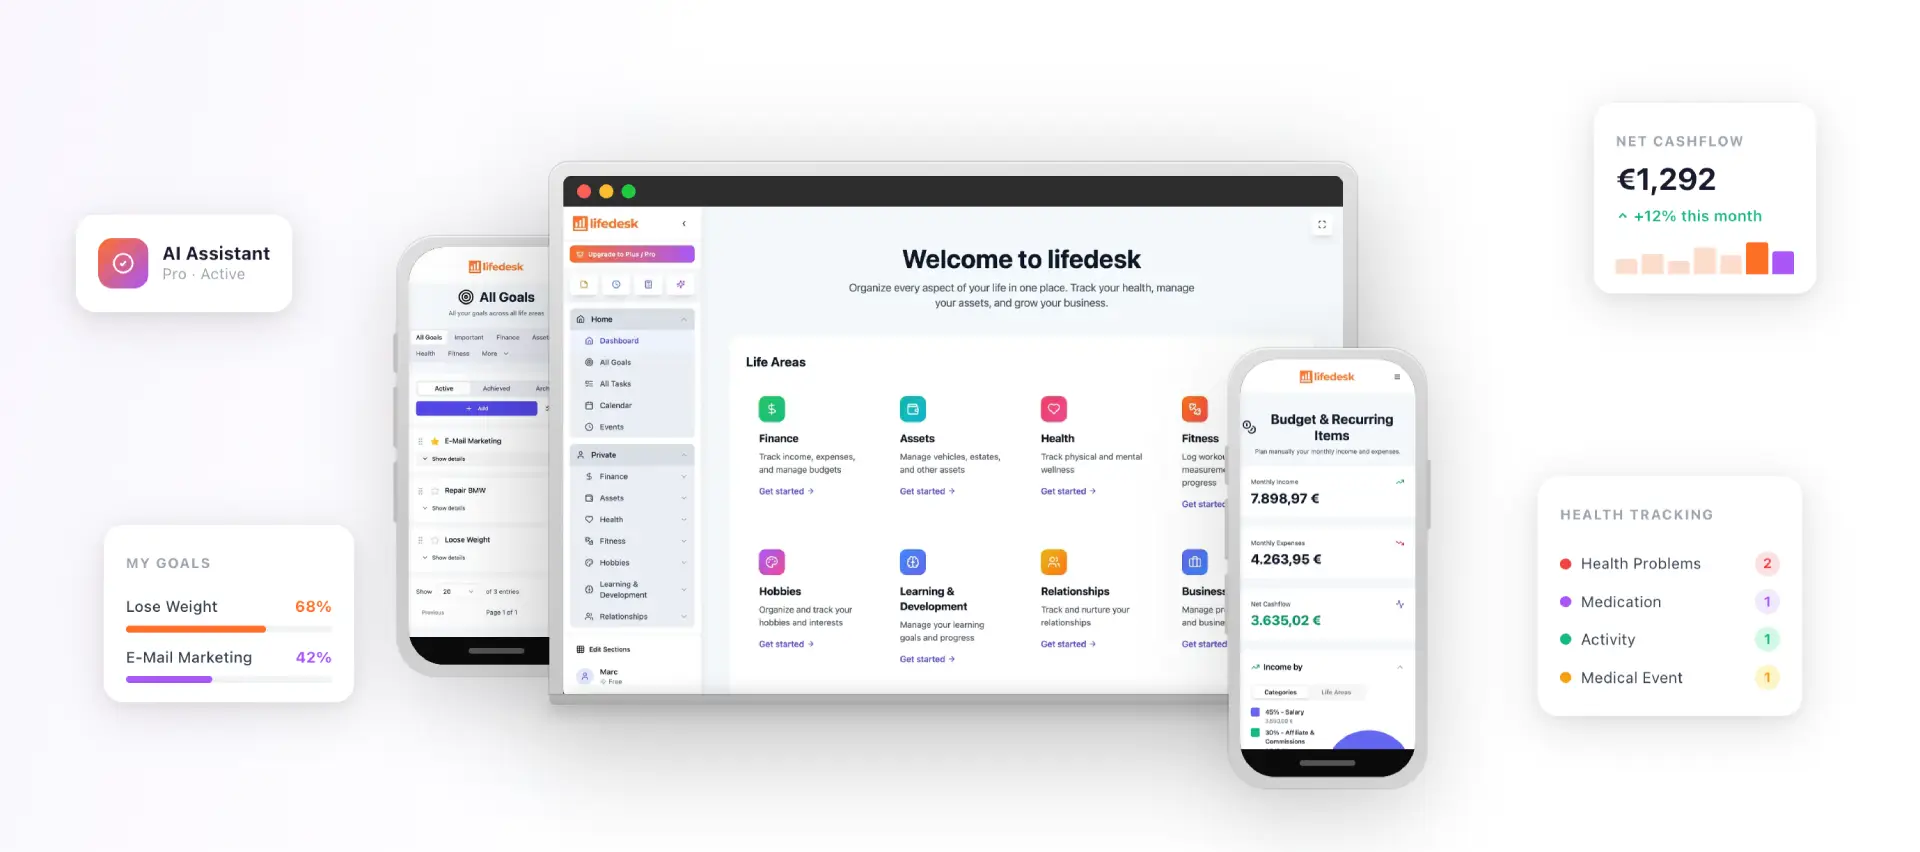
LifeDesk brings tasks, goals, calendars, finances, and health into one app to help you organize personal and professional priorities.
Why do daily metrics differ from lagging indicators?
A lagging indicator tells you what already happened: monthly revenue, quarterly profit, a finished project’s final cost. A daily metric tells you what is happening now, while you can still change it. ICAEW guidance treats daily “current” measures as distinct from lagging results, and says true key indicators should be limited in number so they stay actionable.
The difference shows up in how you use each one:
Lagging indicator: monthly revenue tells you whether last month worked, but it cannot be changed.
Current measure: the number of sales calls made today tells you whether this month is on track while you can still pick up the phone.
Lagging indicator: a completed project’s total hours confirms an estimate was wrong.
Current measure: hours spent on the project’s top-priority task today shows drift early, rather than after it has persisted.
Lagging indicator: body weight or a quarterly review score summarizes habits you already built.
Current measure: a yes or no for today’s workout or planning block shows the habit in progress.
Frequency matters because a short feedback loop makes small experiments cheap. If you notice that you spent no time on your main project, you can block time for it next. If you only notice at a monthly review, the month is gone.
The catch is dilution. Track too many things every day and you will watch none of them closely. ICAEW’s guidance suggests that no more than ten indicators deserve the label “key,” and for a daily routine we would go lower, to a short list. A short list gets read. A long list gets ignored by Thursday.
How do you choose your daily metrics?
Start with a question, not a spreadsheet. A key performance question (KPQ) is a plain-language question about what you need to know, such as “Am I giving my best hours to the work that matters most?” or “Is my pipeline filling fast enough to cover next month’s costs?” The metric is just the daily data that answers it.
Work through four steps for each question:
Write the KPQ. One sentence, tied to a goal you actually hold, personal or business.
Pick the metric. Choose a number you can move through your own actions today.
Name the source. Decide where the number comes from: a timer, a calendar, a bank feed, an ad dashboard, a one-line note.
Assign an owner. One person is responsible for looking at it and acting on it, even if that person is you.
Then run each candidate through a short checklist:
Is it actionable, meaning you can change it through something you do?
Is it a leading or immediate input rather than a final result?
Can you capture it every day in under a minute?
Does it have a single owner?
Does it earn a place in a short list?
A metric that fails several of these goes back on the shelf. Skipping the question step is how teams end up with what Bernard Marr calls “floating KPIs,” numbers that sit on a dashboard with no decision attached. If you want to turn a strategic goal into candidates quickly, our goal-setting frameworks guide shows how to map objectives to measurable targets.
Pro Tip:Draft your KPQ and a range of possible metrics, then cut the list down. The painful cuts are usually the right ones, and an AI prompt such as this strategic priorities KPI template can help you generate the first draft of the list.
Which daily metrics work for productivity, business, marketing, and projects?
Below are copyable starting sets. For each metric, the “why daily” is that you can act on it the same day, and the micro-target is a trigger you can adjust to your own baseline.
Personal productivity
Time on priority tasks. Measures whether your hours match your intentions. Trigger: if it is under your target two days running, block the first hour tomorrow.
Most important tasks completed. Count the one to three tasks you committed to that morning. Trigger: zero completed means tomorrow’s list shrinks.
Deep-work blocks finished. Counts uninterrupted focus sessions. Trigger: none finished means look at where the calendar was broken.
Small business
Sales calls or outreach messages sent. An input you control, unlike closed deals. Trigger: below your minimum by midday, make the next block calls only.
New orders or inquiries received. A fast read on demand. Trigger: a flat day is a note, a flat week is a decision.
Invoices sent and paid. Keeps cash flow visible. Trigger: any invoice past its due date gets a reminder that day.
Bank items reconciled. A small daily habit that prevents month-end pileups.
Marketing
Website sessions. A pulse check on traffic, best read against a seven-day average.
Leads created. The number that connects traffic to revenue. Trigger: a drop against your baseline prompts a check of the last change you made.
Ad spend against conversions over a short window. Catches a runaway campaign before the bill does.
Content published or engaged with. Confirms the publishing rhythm you promised yourself.
Project progress
Tasks or story points completed. Shows real throughput instead of busy time.
Open blocking issues. Anything that stops others from working. Trigger: any blocker older than a day gets an owner.
Deployments or merges. For software teams, this echoes the delivery measures DORA uses, where deployment frequency and lead time for changes help teams measure throughput and stability.
Pick one set, take no more than five, and leave the rest. If you run projects alongside client work, our project management features show how tasks, milestones, and owners line up in one place.
What tools capture daily metrics with the least friction?
The best capture method is the one you will keep using. Friction is the enemy: if recording a number takes too long, you will stop.
Fast manual methods work well for numbers no system produces for you:
A simple timer started when you begin a priority task, stopped when you finish.
A habit tracker for yes or no items such as a workout, a planning block, or outreach done.
A daily check-in form with three to five fields you fill in at the same time every day.
A single-line status update at the end of the day: what moved, what blocked.
Automate whatever already leaves a trail:
Calendar data shows how much of your day went to focused work versus meetings.
Time-tracker exports supply hours per project without extra typing.
Payment and bank feeds supply paid invoices and cash-in without manual entry.
Marketing platform dashboards supply sessions, leads, and spend.
When you compare tools, check four things: how quickly you can enter a number, whether you can see all your metrics on one screen, whether it connects across domains such as tasks, time, and money, and whether it works on both mobile and web. A tool that does three of the four well beats one that does one brilliantly but sits in a tab you never open.
Pro Tip:Automate the metric you hate recording, and keep the one you care about most manual at first. Typing the number yourself builds the habit of looking at it.
For very short founder routines, our entrepreneur habit tracking page shows how to protect a few habits in a brief daily routine, and an AI productivity assistant can summarize the day’s progress so you are not rereading raw numbers.
How do you analyze daily metrics without overreacting?
Daily numbers are noisy. A bad Tuesday is information, not a verdict. The skill is separating a signal from normal variation, and then answering signals with small experiments instead of big reorganizations.
Follow this sequence:
Establish a baseline. Track for a while before judging anything. Your normal range is the reference point.
Smooth the noise. Compare against a rolling average instead of yesterday alone, so one odd day does not drive a decision.
Set a trigger. Decide in advance what counts as a signal, for example “below baseline repeatedly.”
Run a micro-experiment. When a trigger fires, change one thing for a while: a shorter task list, a different outreach time, a paused ad set.
Assign an owner and write it down. Note what you changed and what you expect, so the next review can judge it.
Review in short cycles. A quick daily check, plus a weekly trend look.
The reason to keep actions small is that large reorganizations make it impossible to know what worked. A single change tracked over time gives you a clearer answer.
Regular monitoring of leading indicators is linked to better outcomes in high-performing organizations, but the benefit comes from acting on what you see, not from collecting it. A metric nobody responds to is decoration.
Watch for two failure modes. The first is gaming: if a number becomes a target, people (including you) will find ways to hit it without improving the thing it was meant to represent. Pair a volume metric with a quality check, such as calls made alongside meetings booked. The second is overreaction: changing the plan after one data point. When in doubt, wait for more data and look at the average.
How often should you review daily metrics?
Use three rhythms, each with its own job.
Brief daily operational check. Glance at today’s numbers, note anything past a trigger, decide the one action for tomorrow. This is not analysis time.
Weekly trend review, with enough time set aside to compare trends. Compare this week’s averages with the previous week, look at which micro-experiments ran, and decide what to keep, change, or drop.
Monthly outcome check. Step back to the lagging results: revenue, projects delivered, goals reached. Ask whether the daily metrics you chose actually predicted them.
Short-term targets should be modest and tied to your baseline, not to a wish. If your average is already substantial, a modest increase is a stretch. Aiming for a much larger increase may make the goal unsustainable. Set an escalation rule too: for example, a trigger that keeps firing moves the topic from your daily glance to the weekly agenda.
Know when to retire a metric:
If it has stayed stable and healthy for a while, move it to a less frequent review.
If it never triggered a decision over time, replace it.
If it began to drive bad behavior, drop it and rewrite the KPQ.
If the goal it served has changed, the metric goes with it.
If you tie reviews to a larger plan, our yearly planning guide shows how to map goals to calendar, money, and health so the monthly check has something to compare against.
What does the research say about daily tracking and KPI design?
The pattern across guidance and research is consistent: fewer measures, tied to a question, reviewed often, and kept for long enough to matter. ICAEW recommends limiting key indicators, and the Becker Friedman Institute at the University of Chicago reports that rigorous performance measurement yields larger benefits after sustained adoption, with clearer efficiency gains by the second year as managers internalize the data. The engineering world shows the same principle in a narrow form: DORA’s delivery metrics are a focused set for guiding improvement.
Design effective metrics by starting with key performance questions: define what you need to know first, then pick the daily data that answers them. — paraphrased from Bernard Marr’s guidance on KPQs
Where can you keep all your daily metrics in one place?
Most of the friction in daily tracking comes from scattering: time in one app, tasks in another, money somewhere else. We built LifeDesk so your tasks, goals, calendar, time, and finances live in one view for personal and business work, which makes a short daily metrics check realistic instead of a chore. If you want to see how that setup looks, explore our features, or compare the Free, Plus, and Pro options on our pricing page and set up your first daily check-in today.
FAQ
How do you track day-to-day activities?
Pick a small set of activities tied to one goal, then capture them at the same time each day with a timer, a habit tracker, or a one-line note. Keep the list short so the habit survives busy days. Review a weekly average instead of judging single days.
What does it mean to track metrics?
Tracking metrics means recording the same measures at a regular interval so you can see change over time. The value comes from comparing numbers against a baseline and acting on the gaps. Key performance indicators work best when they link to a goal and stay actionable.
What are some good daily sales metrics?
Good daily sales metrics are inputs you control: outreach messages or calls made, new inquiries received, and follow-ups sent. Pair a volume number with a quality number, such as meetings booked, so you do not trade quality for activity. Closed revenue is a lagging result, better reviewed weekly or monthly.
What do daily metrics mean?
Daily metrics are current, high-frequency measures you check every day to see how things are going while you can still change them. They differ from lagging indicators, which report finished results. ICAEW guidance draws exactly this distinction.